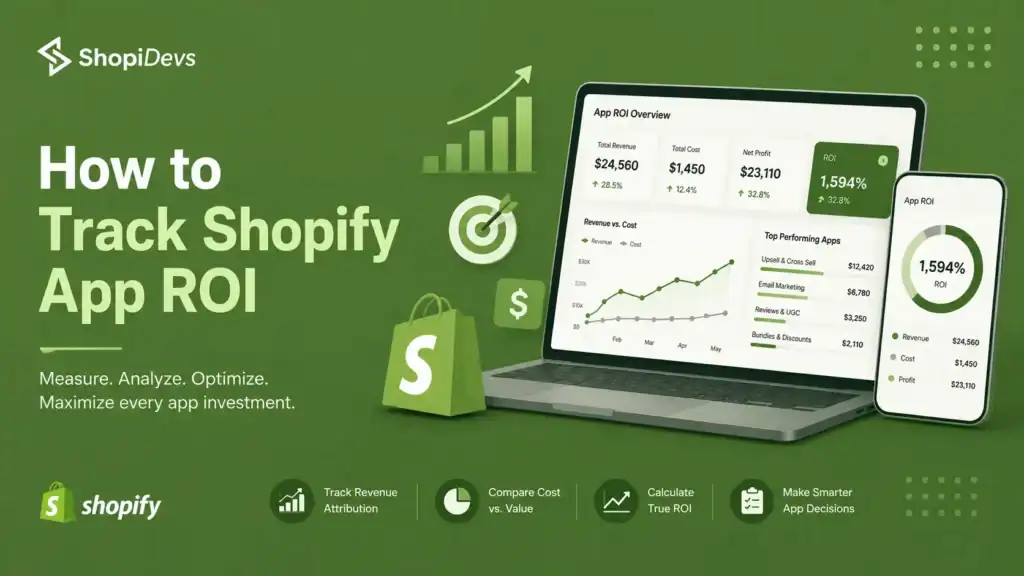
Open your Shopify billing page right now. You’ll see a list of app subscriptions, each with a price, and almost nothing about what that app actually returned.
Most merchants install an app because a review said it worked, run it for a few months, then keep paying because canceling feels riskier than leaving it alone. That’s not a strategy, it’s inertia with a monthly invoice.
The apps worth keeping are the ones that move a number you can point to: more conversions, higher average order value, or fewer hours spent on manual work.
Everything else is a subscription you’re paying out of habit. Below is the actual method for telling the two apart, along with the three metrics that matter and the ones that are just noise.
Shopify app ROI is the revenue gained (or cost saved) from an app minus its monthly subscription fee. To track it: set a measurable goal before installing, record your baseline metric, run the app for 30 days, and compare. If the lift does not cover the cost by at least 3x, the app is not earning its place.
The 3 metrics that matter most: conversion rate change (measured in Shopify Analytics), AOV change (average order value before vs. after), and time saved (hours per week converted to cost at your hourly rate). Every other metric is secondary to these three.
- The average Shopify store pays for 6–8 apps per month. At $20–150 each, that is $120–$1,200 in monthly overhead before a single sale.
- Most merchants never measure whether an app improved the metric it was installed to fix.
- The 3x return rule: an app costing $30/month should generate at least $90/month in measurable lift to justify its cost.
- Uninstalling an app does not always remove its code. Leftover scripts slow your store and can affect SEO rankings.
- The best ROI apps fall into four categories: upsell/cross-sell, conversion optimization, email capture, and speed/SEO.
- Quarterly app audits cut average app spend by 30–40% without reducing store performance, based on merchant case studies across multiple audits.
- Not all ROI is revenue. Backup apps protect against data loss events that can cost $500–$2,000 to recover from. That is risk-mitigation ROI.
What Shopify App ROI Actually Means
Most merchants think about app cost in isolation. App ROI connects that cost to a specific business outcome: a revenue lift, a cost reduction, or a risk avoided. If you cannot name the outcome an app is supposed to deliver, you cannot measure whether it is delivering it.
The real cost of a Shopify app
The subscription fee is only part of the cost. Four costs add up every month you run an app:
- Subscription fee: $5 to $200/month depending on the app and tier.
- Setup and management time: configuring rules, testing, troubleshooting conflicts. Often 1-3 hours/month that nobody accounts for.
- Page speed impact: each app loads JavaScript on every store page. The average app adds 50-200KB of JavaScript. At 6-8 apps, that is 300-1,600KB of extra script weight before a single product image loads.
- Opportunity cost: if a better alternative exists at lower cost or with less JS weight, staying with the current app costs you the delta.
A $50/month app that adds 0.3 seconds to your load time also costs you conversion rate. Research from Deloitte (Milliseconds Make Millions, 2020) shows a 0.1-second improvement in load time increases conversions by 8% on average. That hidden performance tax often exceeds the subscription fee. See the complete guide to Shopify store speed optimization for a full breakdown of the JS load cost per app category.
The invisible cost: A $30/month app that slows your store by 0.2 seconds, on a store with 5,000 monthly visitors at $85 AOV and a 2% conversion rate, costs you roughly $680 in lost revenue from the performance tax alone. The subscription is the cheapest part.
The 3x ROI rule for Shopify apps
An app earning less than 3x its cost is a candidate for removal. The 3x threshold accounts for the hidden costs above, which do not appear on the invoice but hit your bottom line every month.
ROI = ($400 – $X) ÷ $X × 100
At $9.99/month: ROI = ($400 – $9.99) ÷ $9.99 × 100 = 3,904%
The 3x minimum means a $30/month app must generate $90/month. A $10/month app must generate $30/month. This sounds easy for revenue-generating apps. It is harder for apps whose value is in branding, aesthetics, or operational convenience, which is exactly why those categories have the worst ROI track records.
Bottom line: Set your ROI threshold before you install any app, not after 90 days of paying for it without measuring.
ROI vs. cost-saving vs. risk mitigation
Not all app ROI is revenue. Three distinct ROI types require three different measurement frameworks.
- Revenue ROI (upsell, CRO, email apps): Measure the direct revenue lift vs. subscription cost. Use Shopify Analytics.
- Cost-saving ROI (AI, automation apps): Measure hours saved per week multiplied by your hourly rate. If Sidekick AI Studio saves your team 3 hours/week at $50/hour, that is $600/month in time saved before any conversion lift is counted.
- Risk-mitigation ROI (backup, security apps): Measure the cost of the event the app prevents. A single theme corruption costs $500-$2,000 to rebuild from scratch, plus hours of store downtime losing sales.
How to Track Shopify App ROI
Tracking app ROI is a 5-step process. It starts before you install the app, not after. Most merchants skip the baseline step, which makes it impossible to know whether the app made a difference.
Step 1: Define the one metric this app is supposed to move
Every app has one primary job. Write it down before installing. Be specific.
- Upsell app: AOV (average order value)
- Speed/image app: PageSpeed Insights mobile score plus bounce rate
- Review app: review count plus conversion rate
- Email popup: opt-in rate
- Social proof app: product page conversion rate
- AI writing app: hours saved per week on product description copy
Warning: Installing an app because it looks useful is how you end up paying for 12 apps and not knowing what any of them do. If you cannot write down the one metric this app is supposed to move, do not install it yet.
Step 2: Record your baseline (before you install)
This step is where 90% of merchants fail. Go to Shopify Analytics and record the following before installing anything. Screenshot or save these numbers with today’s date.
- Conversion rate: Shopify Analytics, Overview, Online store conversion rate
- Average order value: Shopify Analytics, Overview, Average order value
- Bounce rate and session duration: Google Analytics 4, Reports, Engagement
- PageSpeed mobile score: pagespeed.web.dev, enter your store URL, switch to Mobile tab
Merchants who record a baseline before app installation report being able to make a confident keep/remove decision within 60 days. Without a baseline, most merchants guess, and most guesses default to keeping apps they should have removed months earlier.
This baseline is your before. You need it to calculate the lift at day 30. Without it, you are measuring feelings, not numbers. Learn how to read your Shopify conversion rate and what counts as a meaningful change for your traffic volume before setting up the baseline.
Step 3: Give it 30 days, then measure
30 days is the minimum to see meaningful signal. Less than that and you are reading noise, not data.
What to measure at day 30:
- For upsell apps: Compare AOV (Shopify Analytics, Overview, Average order value). Compare the same 30-day period, not week-over-week.
- For speed apps: Re-run PageSpeed Insights and compare your mobile score. Note the LCP (Largest Contentful Paint) number specifically.
- For social proof apps: Compare product page conversion rate from Shopify Analytics, not overall store conversion rate.
- For AI writing apps: Log hours spent on copy tasks each week. Compare week 1 vs. week 4.
For CRO apps (popups, urgency timers, exit intent), wait 60 days. These apps affect the full conversion funnel and need sufficient traffic to produce statistical significance. Checking at 30 days often shows noise from novelty effects.
Step 4: Apply the ROI formula
App ROI % = (Monthly Lift − App Fee) ÷ App Fee × 100
A $29/month upsell app increases AOV from $85 to $94 (a $9 lift).
The store processes 300 orders/month.
Monthly lift = 300 × $9 = $2,700
App ROI = ($2,700 − $29) ÷ $29 × 100 = 9,210%
Decision thresholds:
ROI under 100% (1x): the app is costing you money. Remove it.
ROI 100%–300% (1x–3x): borderline. Review quarterly, find a cheaper alternative.
ROI above 300% (3x): earns its place. Keep it.
Bottom line: An upsell app generating a 9% AOV lift on 300 orders/month produces more ROI in a single month than most merchants make in a year. The math only exists if you run it.
Step 5: The quarterly app audit
Every 90 days, open your Shopify admin, go to Settings, then Apps and sales channels. Run through every paid app with these four questions:
- What metric was this app installed to improve?
- What is that metric today vs. when I installed it?
- Is the lift worth at least 3x the monthly cost?
- Is there a free or cheaper alternative that does the same job?
Any app that cannot answer question 1 with a specific metric name gets flagged immediately. Any app that fails question 3 for two consecutive quarters gets removed. Review the full Shopify store audit checklist before your first quarterly review to catch issues the app audit alone will not surface.
After uninstalling any app: Open Shopify admin, go to Online Store, click Edit Code, and open the theme.liquid. Search for the uninstalled app’s name, domain, or script tag. Many apps leave JavaScript behind even after removal from the dashboard. That code continues to load on every page and slow your store. Remove it manually or contact the app’s support team to clean it up.
“Merchants who regularly audit their app stack, removing unused or underperforming apps, report faster store load times and lower monthly overhead without any reduction in store performance.”
Shopify Help Center, App performance guidance, 2024
Bottom line: Merchants who complete quarterly app audits consistently report cutting app spend by 30–40% while maintaining or improving store performance. The audit is not optional. It is the system that keeps your tech stack from becoming overhead.
Which App Categories Have the Highest ROI
Not all app categories are equal. Upsell and conversion apps tend to pay back fastest because their impact shows up directly in revenue. Others take longer to see results, or deliver value that is harder to quantify but no less real.
Upsell and cross-sell apps (highest direct ROI)
Upsell apps connect directly to AOV. The feedback loop is fast: you can see AOV change within a week of proper configuration. The math compounds quickly across every order.
of Amazon’s revenue comes from its recommendation engine
(McKinsey, 2023)
AOV lift from well-configured upsell apps on Shopify stores
days to see meaningful AOV signal after app installation
“35% of Amazon’s revenue is generated by its recommendation engine. For Shopify merchants, upsell and cross-sell apps are the closest equivalent, and they are the category with the fastest measurable ROI cycle.”
McKinsey, “How Retailers Can Keep Up with Consumers,” 2023
Track upsell ROI by comparing AOV before and after installation in Shopify Analytics. Also check your upsell strategy for Shopify to confirm the app is configured correctly before your 30-day review. See the best upsell apps for Shopify for a comparison of what each category delivers. Product showcase apps that highlight high-margin items on collection pages are another fast-ROI lever. Combine with recently viewed products sections to capture re-engagement revenue from returning visitors.
Conversion rate optimization apps (high ROI, slower signal)
Social proof, urgency timers, exit intent popups: these apps lift conversion rate across every visitor. A small CVR improvement multiplies across your entire traffic volume, which is why the ROI ceiling is high.
The signal, however, takes 30-60 days to emerge cleanly. Example: a 0.5% CVR lift from 1.4% to 1.9% on a store with 10,000 monthly visitors at $85 AOV generates $4,250 in additional monthly revenue. That math works at any app price under $500/month.
Read the complete CRO guide for Shopify before choosing a CRO app. Also review what social proof apps are available and what metrics each one improves. For checkout optimization alongside CRO apps, see the Shopify checkout page guide.
Speed and SEO apps (high ROI, slowest signal)
Image optimizers, media organizers, and performance tools: their ROI shows up in PageSpeed scores, Google rankings, and reduced bounce rate. The impact on organic traffic takes 60-90 days. The impact on PageSpeed score is immediate and measurable from day one.
Speed ROI calculation: a 10-point PageSpeed mobile score improvement reduces bounce rate by approximately 1-2%. On a store with 5,000 monthly visitors, a 1% bounce rate reduction means 50 more engaged sessions. At a 2% CVR and $85 AOV, that is $85 in monthly revenue from one metric change. Layer in the organic ranking improvement over 90 days and the ROI compiles.
Pair speed tools with the Shopify SEO guide and the 10 Shopify SEO tips to maximize the combined impact. Image optimization is the single highest-impact lever for load time improvement.
This is why the speed cost of every app belongs in your ROI calculation. If an app adds $50 in revenue but drops your PageSpeed score by 8 points and increases bounce rate by 0.8%, the net ROI may be negative. Run full speed optimization before and after any major app install.
Visual merchandising apps (strong ROI for discovery-heavy stores)
Sliders, galleries, and lookbooks drive engagement and product discovery. Their ROI is measured in engagement metrics (time on page, pages per session, collection page CTR) rather than direct revenue, but those engagement improvements feed into conversion rate and SEO dwell time.
Track visual merchandising ROI with these metrics from Google Analytics: session duration (before vs. after), pages per session, and collection page bounce rate. Also check collection page product click-through from Shopify Analytics. Compare these numbers to the months before installation. Explore how to create a photo gallery on Shopify to understand what engagement benchmarks are realistic. For fashion and lifestyle stores, Shopify lookbook apps often deliver the highest engagement lift in this category.
AI copy and productivity apps (ROI in time saved)
AI writing and automation apps do not generate revenue in the way an upsell app does. Their ROI is in two places: hours saved per week (converted to dollar value at your hourly rate) and conversion lift from better, more specific product copy.
Example: Sidekick AI Studio saves 2 hours/week on product description writing. At $50/hour, that is $400/month in time saved before any conversion improvement is measured. If the improved copy also lifts product page CVR by 0.3%, the revenue lift stacks on top of the time savings. Both are measurable. Track hours saved weekly and product page conversion rate separately. Read the best ways to write Shopify product descriptions to set a quality benchmark before using AI to produce them.
Backup and risk mitigation apps (ROI in prevented loss)
Backup apps do not generate revenue. They protect it. The ROI calculation is different: instead of measuring lift, you calculate the cost of the event the app prevents.
- Theme corruption: $500-$2,000 to rebuild from scratch, depending on complexity
- Accidental product deletion: hours of manual re-entry, potential 24-48 hours of an inaccurate product catalog online
- Failed migration or bulk edit: potential days of downtime, support tickets, and lost sales during recovery
Log every close call. Each time a daily backup saves you from having to recover manually, record what that recovery would have cost. Over 12 months, this builds your risk-mitigation ROI case. A backup app at $6.99/month costs $83.88/year. One avoided theme rebuild pays for 17 years of the subscription.
Bottom line: Risk-mitigation ROI is the hardest category to measure and the easiest to justify once you have done the math on what a data loss event actually costs your business.
Apps That Rarely Justify Their Monthly Cost
Some app categories look essential but consistently underperform on ROI. This does not mean every app in these categories is bad. It means you need to apply the 3x rule more carefully before paying for them.
Apps that duplicate Shopify’s built-in features
Shopify’s native feature set has expanded significantly since 2022. Before paying for an app, check whether Shopify already does the job well enough.
Shopify already includes:
- Basic email capture and campaigns (Shopify Email)
- Discount codes, gift cards, and automatic discounts
- Basic product reviews (Shopify Reviews, available on Shopify Online Store 2.0)
- Abandoned cart email recovery
- Basic analytics and conversion reporting
- Blog, pages, and basic SEO meta fields
Check your Theme Editor first: If you are paying for a basic countdown timer, a simple FAQ builder, a size chart, or a basic announcement bar, open your Theme Editor (Online Store, Themes, Customize) and check the Available Sections panel. Many Shopify OS 2.0 themes include these as native sections that cost nothing and add zero JavaScript weight. Also check which discount popup apps offer genuine lift vs. what the native Shopify discount system already handles.
Apps installed for problems you do not have yet
A loyalty app for a store doing 50 orders/month is premature. A subscription app before you have validated recurring demand is overhead without return. Both add JavaScript, cost money, and require management time.
The rule: install apps that solve a problem you have right now. Not problems you might have at 10x your current scale. A store needs to earn the complexity of its tech stack. Review the Shopify store launch checklist and the compare-at price guide before adding pricing display apps to confirm you actually need external tooling vs. Shopify’s native compare-at field.
Apps with vanity metrics as their primary output
Social share counters, follower count displays, generic “engagement dashboards,” and apps that show you how many people viewed your products without connecting that data to orders: these show activity, not revenue.
The test: can you draw a direct line from the app’s output to a specific revenue increase or cost reduction? If the only thing the app improves is a metric you cannot connect to revenue, AOV, cost, or risk, it is decorative. Decorative apps fail the 3x rule every time.
Bottom line: Run every app through the 3x test at the 30-day mark. If it cannot clear that bar, the default answer is removal. Keeping an underperforming app because you are not sure what it does is the exact behavior that turns a $200/month app budget into $800/month of overhead with no measurable return.
The Shopify App ROI Audit Table
Use this table as your quarterly audit template. Go through every paid app you have installed and fill in each column. Copy it into a spreadsheet and update it every 90 days. Any app that scores below 100% ROI is a removal candidate.
Columns to add for your own apps: installation date, last reviewed date, free alternative available (yes/no), and next review date. Keep this spreadsheet alongside your Shopify Analytics dashboard and update it at the start of every quarter before paying the next round of subscriptions.
Frequently asked questions
The most common questions merchants ask about Shopify app ROI, with direct answers and no filler.
How do I calculate Shopify app ROI?
Use this formula: App ROI % = (Monthly Lift in Revenue or Cost Saved minus App Monthly Fee) divided by App Monthly Fee, times 100.
First, record your baseline metric before installing. Run the app for 30 days. Then calculate: Monthly Lift = (New Metric minus Old Metric) times Monthly Orders times AOV.
Example: a $29/month app increases AOV from $85 to $94. Store processes 300 orders/month. Monthly lift = 300 x $9 = $2,700. ROI = ($2,700 minus $29) divided by $29 x 100 = 9,210%.
Are Shopify apps worth the monthly cost?
Only if you measure them. The average Shopify merchant pays for 6 apps per month but most never track whether those apps improved the metric they were installed to fix.
An app is worth its cost when it generates at least 3x its monthly fee in measurable revenue lift or cost savings. Apps that cannot clear that threshold are candidates for removal. The 3x rule accounts for hidden costs: page speed impact, management time, and opportunity cost.
Which Shopify apps have the best ROI?
Upsell and cross-sell apps consistently deliver the fastest and highest ROI because they connect directly to AOV, a metric you can measure in days. Conversion rate optimization apps have high ROI but take 30-60 days to show clean signal. Speed and SEO apps take 60-90 days to show results in organic traffic and bounce rate. AI productivity apps deliver ROI in time saved. Backup apps deliver risk-mitigation ROI when a data loss event is prevented.
Should I remove Shopify apps I am not using?
Yes, immediately. Unused apps still load their JavaScript on every page. This costs you load time, conversion rate, and often a monthly fee.
After uninstalling, open Shopify admin, go to Online Store, click Edit Code, and open theme.liquid. Search for the uninstalled app’s name. Many apps leave script tags behind even after removal from the dashboard. Remove those tags manually or ask the app’s support team to clean up. Merchants report speed score jumps of 20-30 points after a thorough app cleanup.
What is a good ROI for a Shopify app?
The minimum acceptable threshold is 3x (300% ROI). This means a $30/month app should generate at least $90/month in measurable lift. The 3x rule accounts for hidden costs: page speed impact, management time, and opportunity cost.
Well-configured upsell apps regularly return 1,000-10,000% ROI because AOV lifts multiply across every order. Apps returning under 100% ROI (1x) are actively costing you money. Apps returning 100-300% ROI are borderline and should be reviewed quarterly.

Nahid Komol is a product marketer and GTM strategist specializing in WordPress, SaaS, and AI-integrated growth (AEO, AIO, GEO). With 10+ years of hands-on experience at brands like FunnelKit, FlyWP, and weDevs, he brings deep expertise in content strategy, product positioning, user acquisition, and full-funnel marketing. He's led campaigns generating $100K in sales, grown organic traffic by 70%, and ranked 500+ articles on Google, and is now building AI agent workflows that automate core marketing operations at scale. When he's not crafting strategies or engineering prompt systems, you'll find him exploring sci-fi, composing music, or capturing the quiet poetry of nature through his lens.