Most Shopify merchants track revenue. Few track the seven metrics that explain where revenue is coming from, why it is stalling, and which part of the store is leaking buyers before checkout. The result: months of guessing, fixing the wrong things, and spending on ads that cannot work because the store is not ready.
This guide gives you a structured performance review across seven areas. Each area has a benchmark, a specific diagnostic question, and a clear action when the score falls short. Work through it once per quarter and you will always know exactly where to focus next.
A Shopify store performance review checks 7 areas: traffic quality, conversion rate, average order value, page speed, product page health, cart dropout rate, and SEO visibility. Each has a benchmark. If your numbers fall below it, that area is costing you revenue.
The 3 areas that fail most often: product pages (weak copy and images), page speed (app bloat and oversized images), and checkout dropout (surprise shipping costs and too many form fields). Fix these three first before touching anything else.
KEY TAKEAWAYS
- The average Shopify CVR is 1.4% (Littledata, 2025). Top 20% of stores convert at 3.3% or higher. Under 1% means one area is creating a clear bottleneck.
- A bounce rate of 40–55% is normal for Shopify stores (Blendcommerce). Above 60% on paid traffic signals an ad-to-landing-page mismatch, not a design problem.
- 70% of shoppers abandon their cart before completing checkout (Baymard Institute). Above 80% at any single checkout step points to a specific, fixable friction point.
- 53% of mobile visitors leave if a page takes more than 3 seconds to load (Google). Each additional second costs roughly 7% of your conversion rate.
- Add-to-cart rate under 5% on a high-traffic product means the product page is the problem, not traffic volume. Fix the page before running more ads.
- SEO impressions without clicks (CTR under 1%) usually means your meta titles are weak. Rewrite the title before changing anything on the page itself.
- The full review takes 60–90 minutes. Run it once per quarter and after any major store change.
What a Shopify Store Performance Review Covers
A performance review is not a design critique. It is a structured check of the metrics that tell you whether your store is converting visitors into buyers, and where revenue is leaking. There are 7 areas, each with a benchmark and a diagnostic question that points directly to the next action.
The 7 Performance Areas and Their Benchmarks
Use this table as your starting point. Every metric here has a clear Good, Average, and Poor threshold. Any area scoring Poor is worth fixing before running another ad or publishing another blog post.
How to Run the Review
The review takes 60-90 minutes. Run it with three tools open at the same time: Shopify Admin (Analytics section), Google Analytics 4, and Google Search Console. Before you start making any changes based on what you find, back up your store.
Syncora: Automated daily backups before you make changes
Every performance fix involves changing something in your store. Syncora backs up your theme, products, and settings daily so you can restore to any point if a change goes wrong. It takes one click to set up and runs automatically.
Start the review by recording your current score for each of the 7 areas in the benchmark table above. Use the benchmarks to assign each one a rating: Good, Average, or Poor. This scorecard tells you where to spend your next 30 days.
Internal reference: the full Shopify store audit guide covers pre-redesign checks in more depth, including redirect mapping and app conflict testing.
Shopify Store Audit: 8 Steps to Check
Each area has one primary metric, one specific place to find it, and one diagnostic question. Work through all 7. Flag anything that lands in Poor or Average on the benchmark table.
1. Traffic Quality: Are the Right People Arriving?
- Where to check: GA4 → Reports → Acquisition → Traffic Acquisition
Look at bounce rate and engagement rate by channel. The diagnostic question is: are the visitors arriving from sources that match your product’s buyer profile?
Paid traffic with a bounce rate above 70% means your ad targeting is off, or your landing page does not match the ad promise. Organic traffic with a high bounce rate usually means your content is ranking for keywords that do not match buyer intent.
Do not redesign the page before checking the traffic source. A high bounce rate on paid traffic is an audience targeting problem, not a page design problem. Fix the ad audience first.
Check out this guide to learn about the Shopify conversion rate optimization guide. It covers traffic segmentation in detail and explains which channels typically convert best for Shopify stores.
2. Conversion Rate: Are Visitors Buying?
- Where to check: Shopify Admin → Analytics → Overview → Conversion rate
Compare your CVR to the 1.4% industry average (Littledata, 2025). The top 10% of Shopify stores convert at 4.7% or higher. If you are under 1%, one specific area is creating the bottleneck.
Low CVR usually points to one of three causes: weak product pages (insufficient trust signals, poor images, copy that does not address objections), checkout friction (too many fields, surprise costs), or a price-to-value mismatch.
“The average large-scale ecommerce site can increase conversion rates by 35.26% through better checkout design alone. For most Shopify stores, checkout friction is the primary conversion bottleneck, not traffic volume.”
Don’t forget to check these guide about CRO for Shopify and Shopify checkout optimization for specific fixes for low CVR at each stage of the funnel.
3. Average Order Value: Are Buyers Spending Enough?
- Where to check: Shopify Admin → Analytics → Overview → Average order value
Compare AOV month-over-month and against the category benchmarks in the table above. Low AOV usually means you have no upsell or cross-sell at the product or cart stage, no bundle options, and no free shipping threshold to incentivize larger orders.
A free shipping threshold set just above your current AOV is one of the fastest and lowest-effort ways to push the number up. If your AOV is $65, set the free shipping threshold at $85. Many buyers will add one more item to qualify.
EasyDisplay: Put the right products in front of buyers
EasyDisplay adds curated product showcases to your homepage and product pages, putting high-margin or frequently-bought products in front of buyers at the right moment. Track the impact by comparing AOV before and after in Shopify Analytics.
For a deeper AOV strategy: upsell strategies for Shopify and the best upsell apps for Shopify cover the tools and tactics that move AOV the fastest.
4. Page Speed: Is the Store Fast Enough to Hold Attention?
- Where to check: Google PageSpeed Insights (enter your URL) + Shopify Admin → Online Store → Themes → Speed
Target a mobile score of 60 or higher. Under 30 is a critical issue that affects every visitor. Google data shows that each additional second of load time costs roughly 7% of your conversion rate. At a mobile score of 25, your store is losing buyers before they see a single product.
The most common causes: unoptimized images (images account for 60-80% of average page weight), app bloat (each installed app adds JavaScript that loads on every page), and render-blocking third-party scripts from analytics tools, live chat, or popup plugins.
For a full speed fix guide: Shopify store speed optimization covers every cause of a low PageSpeed score with step-by-step fixes. Also relevant: 10 Shopify SEO tips explains how Core Web Vitals affect your Google rankings.
5. Product Page Health: Are Product Pages Converting?
- Where to check: Shopify Admin → Analytics → Reports → Sales by product (filter by high-view, low-purchase products)
An add-to-cart rate under 5% on a product receiving over 500 monthly views is a product page problem, not a traffic problem. The visitors are arriving. The page is not convincing them to act.
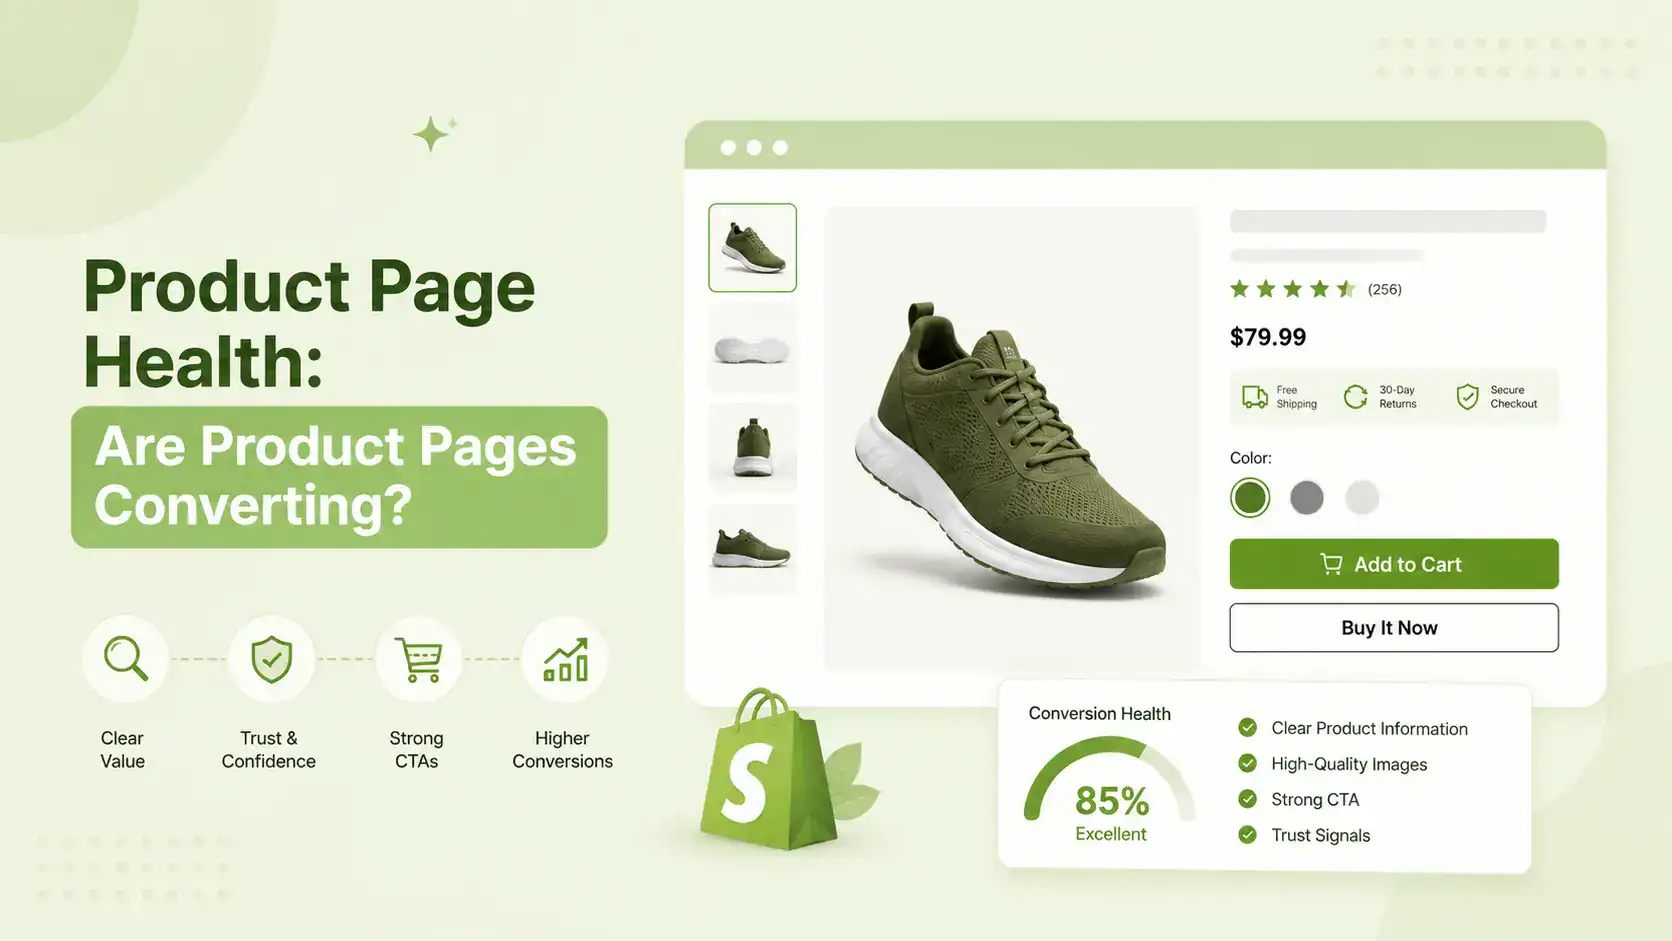
The most common product page failures: the primary image is a white-background product shot with no context, the description lists features without addressing the buyer’s main objection, there are fewer than 10 reviews visible, or the CTA button is below the fold on mobile.
See also: how to write Shopify product descriptions and Shopify product photography for the two fastest product page wins.
6. Collection and Gallery Performance: Are Products Being Discovered?
- Where to check: GA4 → Pages and Screens → filter by /collections/ → check engagement rate and pages per session
Collection pages with low engagement and a pages-per-session under 2 tell you buyers are not browsing. They land on one collection, do not find what they need quickly, and leave. Flat grids with no visual hierarchy and no product discovery path cause this.
A well-structured product grid with visual merchandising, category filtering, and lifestyle imagery increases pages-per-session and drives more product page views from the same traffic.
Related reading: creating a Shopify photo gallery and Shopify lookbook apps for visual merchandising options beyond standard collection grids.
7. Cart to Checkout: Where Are Buyers Dropping Out?
- Where to check: Shopify Admin → Analytics → Checkout funnel (or GA4 → Explore → Funnel exploration)
The average cart abandonment rate is 70.19% across ecommerce (Baymard Institute, 2023). Above 80% at any individual checkout step is a specific UX problem with a specific fix.
Three distinct dropout points: cart page dropout means missing trust signals or a surprise shipping cost appearing late. Checkout initiation dropout means too many form fields or a required account creation. Payment screen dropout means limited payment options or a confusing card input layout.
The fix depends on which step is losing buyers. Identify the step first. Then fix that step specifically, not the whole checkout. See Shopify checkout optimization for step-by-step fixes per dropout point.
Bottom line: A buyer who reaches the cart is your warmest lead. Above 80% dropout at any single checkout step means money is leaving before it reaches your account.
8. SEO Visibility: Is the Store Findable?
- Where to check: Google Search Console → Performance → Search results
Look at total clicks, impressions, average CTR, and average position. Red flags: total organic sessions under 10% of all traffic, declining impressions over 90 days, and pages ranking in position 5-15 with CTR under 1%.
High impressions with low CTR is a title and description problem. Google is showing your page.
Buyers are choosing a competitor’s result instead. Rewrite the meta title to include the primary keyword in the first 60 characters and add a specific reason to click (a benefit, a number, or a question answered). Test one page first. CTR improvement is visible in Search Console within 2-3 weeks.
Check out these guides about the Shopify SEO guide and 10 Shopify SEO tips for a complete organic visibility strategy.
The Performance Scorecard: Rating Your Store
After checking all 7 areas, assign each one a score: Good, Average, or Poor. The scorecard tells you where to spend your next 30 days. Poor scores always come first. They have the highest revenue impact and the clearest path to improvement.
How to Prioritize Fixes by Revenue Impact
Fix Priority by Revenue Impact
Start with the highest-impact, lowest-effort fixes. Work down the list.
| AREA | FIX FIRST IF… | REVENUE IMPACT | EFFORT |
|---|---|---|---|
| Conversion Rate | CVR under 1% | Very High | Medium |
| Page Speed | Mobile score under 30 | High | Low |
| Product Pages | Add-to-cart under 5% | High | Medium |
| Cart Dropout | Abandonment above 80% | High | Low |
| Traffic Quality | Bounce rate above 65% | Medium | High |
| AOV | AOV under $65 | Medium | Medium |
| SEO Visibility | Organic under 10% | Long-term | High |
Revenue Impact: Very High = affects every session. High = affects most buyers. Medium = affects specific segments. Long-term = 90+ days to see measurable return.
The 30-Day Performance Fix Plan
Do not try to fix everything at once. One area per week produces cleaner data and avoids the confusion of multiple simultaneous changes affecting the same metric.
Week 1: Fix page speed. Compress your top 20 product images below 200KB. Remove any app you have not used in 30 days. Re-run PageSpeed Insights and confirm the score moved.
Week 2: Fix your top 3 product pages. Rewrite the description for each one. Replace white-background images with lifestyle shots. Confirm the CTA button is above the fold on mobile.
Week 3: Fix your biggest checkout dropout point. Identify the step in the funnel report. Address that step only, whether it is removing a required account creation or adding a visible free shipping notice at checkout.
Week 4: Address traffic quality or AOV based on which scored Poor. For traffic: audit your ad audiences or review which organic keywords are sending bouncing visitors. For AOV: add a free shipping threshold and one upsell to your top 3 product pages.
In most Shopify store reviews I have run, the same pattern appears: traffic is fine, ads are running, but the product pages are converting at under 4%. The store owner wants to test new ad creatives or switch platforms. The real fix is always the product page. Fix that one thing before changing anything else.
Also relevant: how to track Shopify app ROI walks through the quarterly app audit process so you can identify which apps are hurting speed and which ones are generating measurable returns. And adding social proof to your Shopify store covers one of the fastest CVR improvements available.
Common Shopify Performance Problems and Their Fixes
Most Shopify stores share the same performance problems. The niche and traffic source change the scale, but rarely the problem type. These are the 5 most common issues found in store reviews, with the specific fix for each.
Problem 1: High Traffic, Low Conversion Rate
Symptom: 10,000 or more monthly visitors, CVR under 1%.
Root cause: Product page weakness. Photos show the product on a white background with no context. Copy lists features but does not address the buyer’s main objection. Reviews are sparse or missing. The trust signal bar does not appear above the fold on mobile.
Fix: Audit your top 5 traffic-receiving product pages. Check three things for each: is the primary image a lifestyle shot showing the product in use? Does the description answer “why this, why now, why from you?” Are there at least 10 reviews visible without scrolling?
Do not run a discount or change pricing before fixing the product page. A cheap price on a weak page still does not convert. Fix the page first, then test pricing if CVR is still low.
Problem 2: Traffic Growing, Revenue Flat
Symptom: Sessions increasing month-over-month but revenue is flat or declining.
Root cause: Traffic quality. New traffic from paid ads or viral social posts often does not match your buyer profile. Each new visitor brings a lower purchase intent than the organic visitors who found you through search.
Fix: Segment traffic in GA4 by channel. Compare CVR for organic versus paid versus social. If paid traffic converts at 0.3% while organic converts at 2.1%, the ad targeting is the problem. Stop sending more traffic until the targeting matches your buyer profile. See the conversion rate optimization guide for channel-by-channel CVR benchmarks.
“The average Shopify store conversion rate is 1.4%. Stores in the top 20% convert at 3.3% or higher. The difference is rarely traffic volume. It is almost always product page quality, trust signals, and checkout experience.”
Source: Littledata Shopify Benchmarks, 2025
Problem 3: Strong Desktop CVR, Weak Mobile CVR
Symptom: Desktop CVR above 2%, mobile CVR under 0.8%.
Root cause: The store was designed for desktop and tested on desktop. Most Shopify traffic is mobile. A layout that works on a 1440px screen often breaks on a 390px screen in ways that are invisible without testing on a real device.
Fix: Open your store on a real mobile device. Test three things: can you add to cart in under 3 taps? Is the CTA button visible above the fold without scrolling? Does the checkout form feel natural on a touchscreen with no hidden or overlapping fields? Fix the gaps on mobile before running any mobile ad campaigns. See the store audit guide for a mobile-specific audit checklist.
Problem 4: App Bloat Killing Page Speed
Symptom: PageSpeed Insights score under 35 despite no obvious oversized images.
Root cause: Too many installed apps. Each app loads JavaScript on every page, even pages where that app does nothing. Ten apps at an average of 100KB of JS each adds 1MB of script to every page load.
Fix: Open Chrome DevTools, go to the Network tab, filter by JS, and identify any external domains loading scripts you do not recognize. Trace each one back to an installed app. Remove every app you have not used actively in the past 30 days. After uninstalling, check your theme.liquid file for leftover script tags that apps leave behind even after removal.
For a full app audit process: how to track Shopify app ROI includes a step-by-step quarterly app audit with a pre-filled scorecard template.
Problem 5: High SEO Impressions, Low Clicks
Symptom: Google Search Console shows 50,000 or more monthly impressions but fewer than 500 clicks. CTR under 1%.
Root cause: Meta titles and descriptions are weak or auto-generated. Shopify defaults to product names and store names in meta titles, which are rarely competitive or persuasive enough to win a click over a competitor who has written a specific, benefit-led title.
Fix: In Search Console, sort pages by impressions. For every page ranking in position 5-15, rewrite the meta title: include the primary keyword in the first 60 characters and add one specific reason to click, whether that is a number, a benefit, or a question that matches what the searcher is trying to answer. Test 5 pages first. CTR changes are visible in Search Console within 2-3 weeks.
“53% of mobile site visits are abandoned if a page takes longer than three seconds to load. For Shopify stores where mobile traffic exceeds 60% of all sessions, page speed is not a technical metric. It is a revenue metric.”
Source: Google / SOASTA Research, “The State of Online Retail Performance,” 2017. Foundational benchmark, widely cited through 2025.
See also: best Shopify discount popup apps for tools that recover abandoning visitors, and the Shopify store launch checklist for a full pre-launch performance baseline.
Frequently Asked Questions
How do I know if my Shopify store is performing well?
Check 7 metrics: bounce rate (target under 40%), conversion rate (target 1.4%+), average order value relative to your category, mobile PageSpeed score (target 60+), add-to-cart rate (target 5%+), cart abandonment rate (target under 70%), and organic traffic share (target 20%+). Any metric in the Poor column on the benchmark table points to a specific problem with a specific fix.
What is a good conversion rate for Shopify?
The average Shopify store converts at 1.4% (Littledata, 2025). Stores in the top 20% convert at 3.3% or higher. Top 10% stores reach 4.7%+. If you are under 1%, one part of your store is creating a clear bottleneck. The most common cause is a weak product page, not low traffic.
How do I review my Shopify store analytics?
Use three tools together: Shopify Admin (Analytics section) for revenue metrics including CVR, AOV, and add-to-cart rate; Google Analytics 4 for behavior metrics including bounce rate, session depth, and traffic source breakdowns; and Google Search Console for SEO metrics including clicks, impressions, average CTR, and keyword rankings.
Why is my Shopify store getting traffic but no sales?
Traffic without sales usually comes from one of three causes: the wrong traffic (visitors from channels or ads that do not match your buyer profile), weak product pages (insufficient trust signals, poor images, or copy that does not address objections), or checkout friction (surprise shipping costs, required account creation, or too many form steps). Diagnose which one it is by checking bounce rate by channel, add-to-cart rate by product, and checkout dropout by step.
What is a good bounce rate for a Shopify store?
A bounce rate of 40-55% is typical for Shopify stores (Blendcommerce benchmark data). Under 35% is strong. Above 60% on paid traffic signals a mismatch between your ad creative and your landing page. Above 60% on organic traffic means your content is ranking for keywords that do not match buyer intent. The fix is different for each channel.
Fix What Is Holding Your Store Back
Start with a backup. Then optimize one area at a time.

Nahid Komol is a product marketer and GTM strategist specializing in WordPress, SaaS, and AI-integrated growth (AEO, AIO, GEO). With 10+ years of hands-on experience at brands like FunnelKit, FlyWP, and weDevs, he brings deep expertise in content strategy, product positioning, user acquisition, and full-funnel marketing. He's led campaigns generating $100K in sales, grown organic traffic by 70%, and ranked 500+ articles on Google, and is now building AI agent workflows that automate core marketing operations at scale. When he's not crafting strategies or engineering prompt systems, you'll find him exploring sci-fi, composing music, or capturing the quiet poetry of nature through his lens.